


Manage activity with reports, analyses, pivot tables and Excel exports
Objective. Answer a management question with reports, pivot tables and Excel while preserving scope, source definitions and the distinction between budgeted, actual, invoiced and paid values.
Before you start: select the scope to manage
In your subscription, choose a matter with one consistent period across budget, time, expenses, invoices and payments. Record company, customer, matter, dates, currency and each indicator definition. Check your rights to reports and pivots before comparing results.
Numerical worksheet to calculate separately
Management asks: Why does matter BATIS-2026-12 appear less profitable than expected, and what action should be taken? The following values form a calculation worksheet and are used only for the calculation: commercial budget EUR 12,000.00 net; time budget 80 hours at EUR 50.00, or EUR 4,000.00; actual time 110 hours at EUR 52.00, or EUR 5,720.00; actual expenses EUR 480.00; issued invoices EUR 10,000.00 net; received payments EUR 8,000.00. The variance is +30 hours, amount still to invoice EUR 2,000.00, amount still to collect EUR 2,000.00 and simple invoiced-minus-direct-cost contribution EUR 3,800.00. Keep this worksheet separate from the values of your selected matter and compare its formula with the chosen report definition.
Prerequisites
- The worksheet uses BATIS-2026-12 and one consistent date range; do not search for these values in Tempolia.
- Historical cost rates and report definitions are known.
- The business question and decision sought are written before choosing the tool.
- Your rights allow access to the selected matter; compare access scope if users obtain different displayed totals.
70-minute schedule
- 8 min: state the question and freeze scope.
- 12 min: choose the report and set filters.
- 15 min: reconstruct budget, time and expenses.
- 15 min: reconcile invoices, payments and balance.
- 12 min: reproduce the analysis in pivot or export.
- 8 min: formulate diagnosis, decision and indicator limits.
Worksheet checkpoints
- The calculation returns 110 hours, EUR 5,720.00 time cost and EUR 480.00 expenses.
- The worksheet uses EUR 10,000.00 invoiced and EUR 8,000.00 paid.
- Pivot design keeps budget, actual, invoiced and paid as separate measures.
- Conclusion separates workload, billing and collection actions.
Choose a tool from the decision, not from habit
A standard report answers a recurring question with governed columns and presentation. A pivot explores axes and groupings interactively. An export supplies detailed data for Excel or another system. None is a truth outside its filters, rights, date conventions and calculation definitions.
Begin with grain: one time line, expense, budget line, invoice or payment. Verify samples before aggregating. Define whether cost uses historical or current rates, whether margin is based on production or invoicing, and whether amounts are net or gross. A plausible total can still mix incompatible measures.
Keep facts, calculations, interpretation and decision distinct. The +30 hours are a worksheet calculation; a cause such as scope growth is an interpretation requiring evidence; renegotiating fees is a decision. This separation prevents a dashboard from replacing management judgment.
1. Lock the real perimeter and run the report
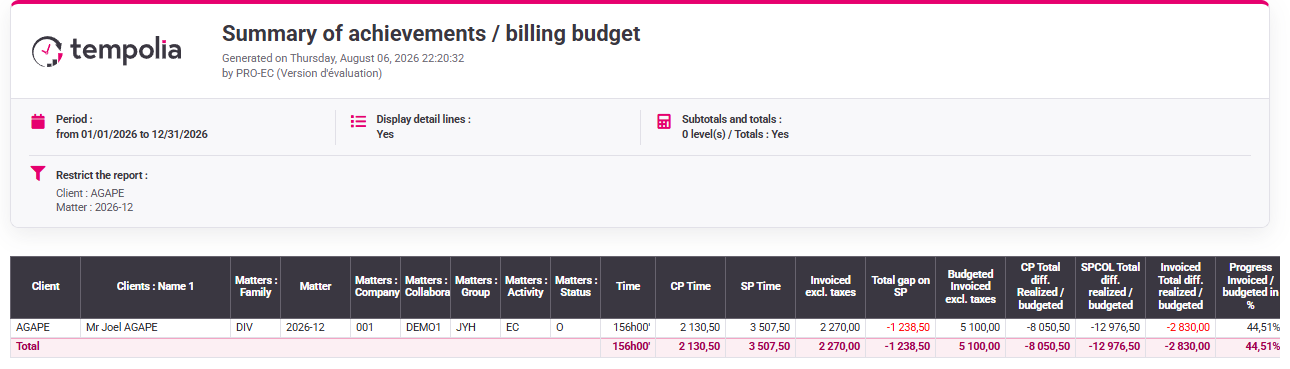
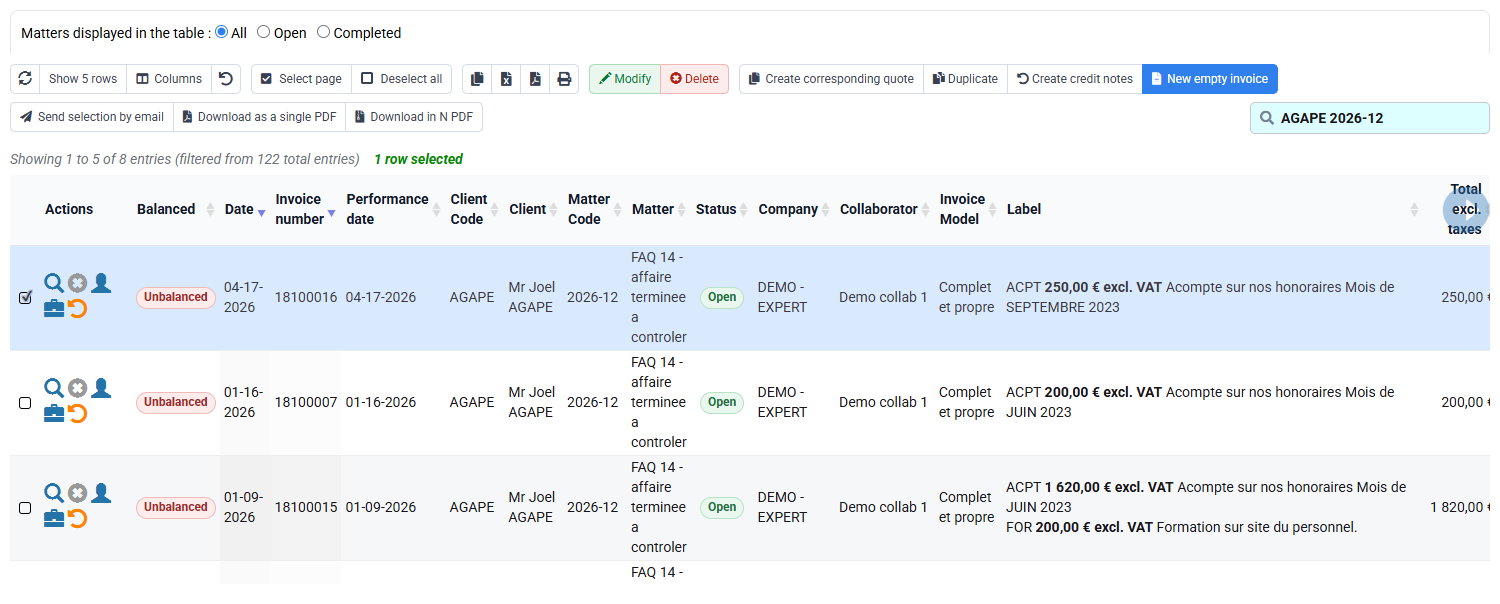
Open Reports / Analyses and select the customer, matter and complete period chosen in your subscription, together with the relevant company, currency and net or gross basis. Show active filters and columns. A report form without a populated result is not evidence.
Record the total exactly as displayed and understand each calculated column. Do not expect 110 hours: that number belongs to the separate BATIS worksheet. If two users obtain different totals for the selected matter, inspect dates, approval, task exclusions, saved views and rights before interpreting the difference.
2. Return to the real time, expenses, invoices and payments
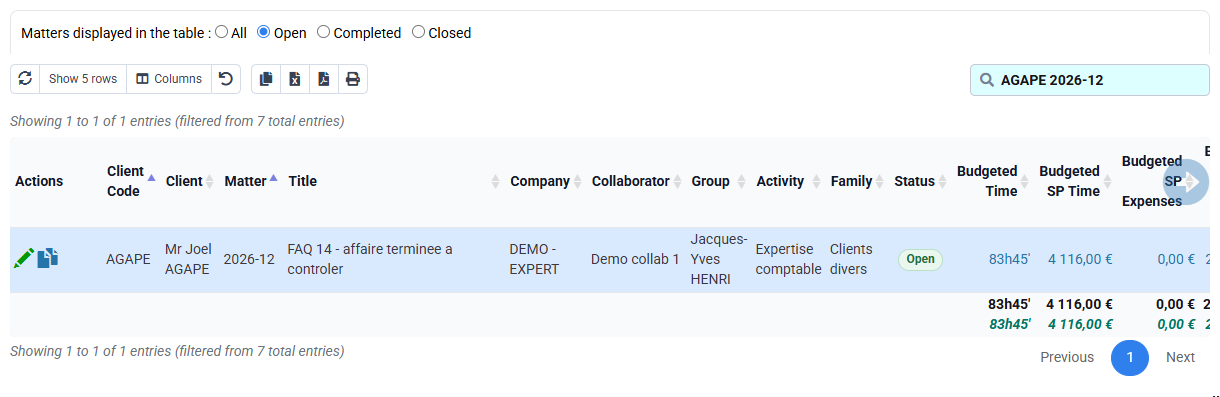
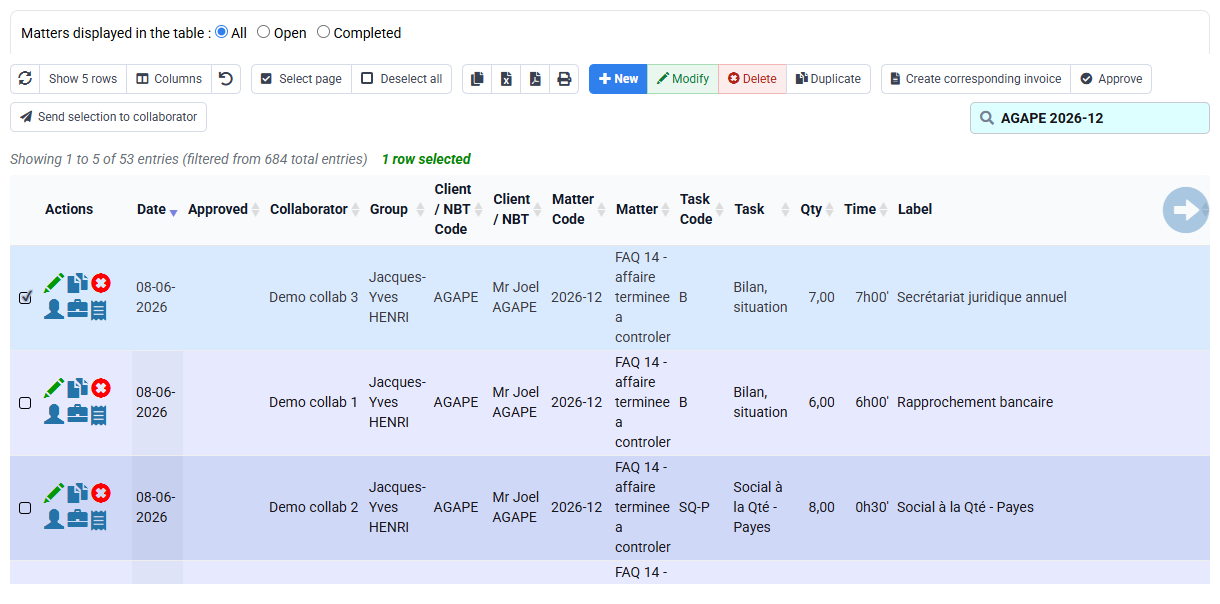
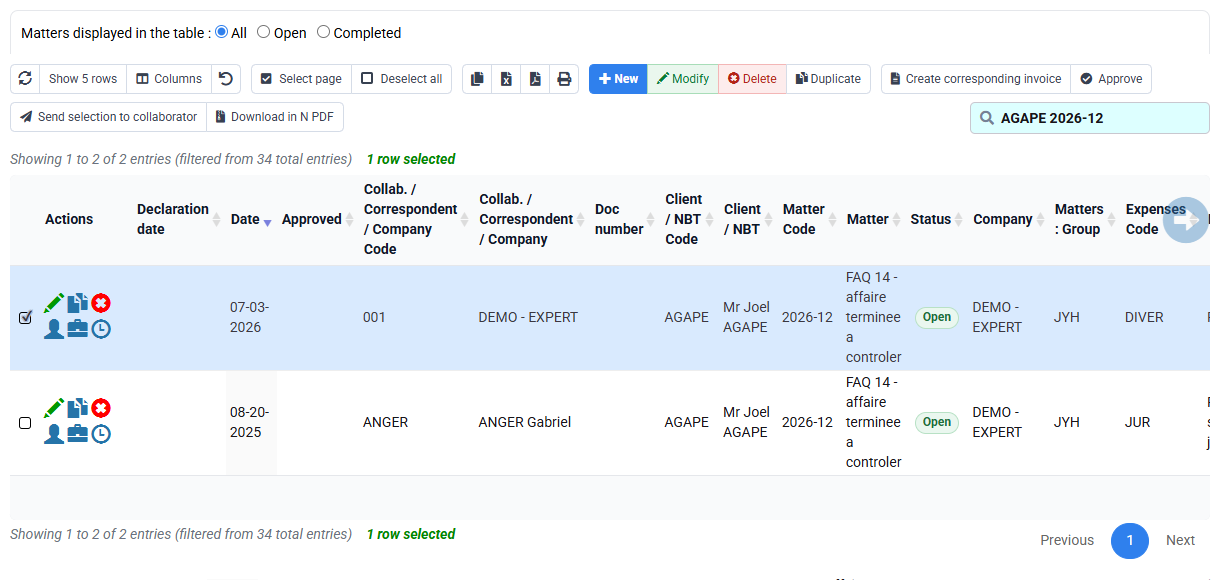
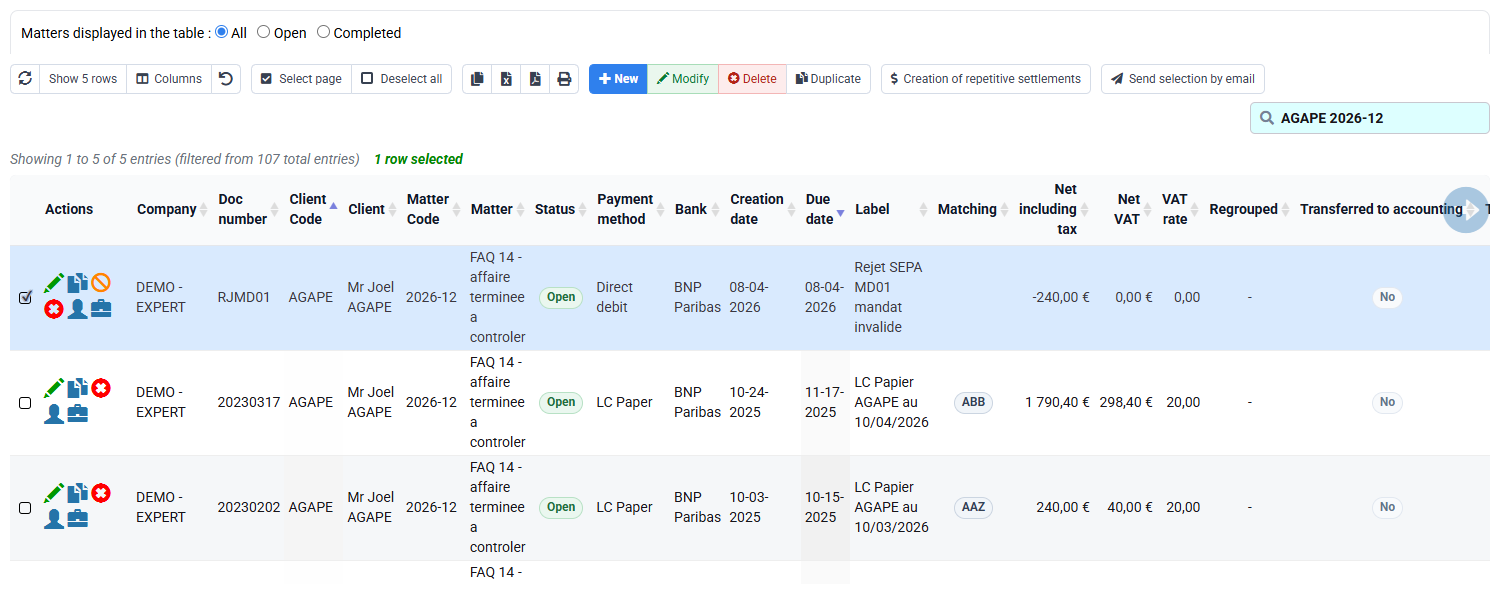
Within the same selected perimeter, open time detail and record its actual total and lines. Do the same for expenses, issued invoices and payments. Document lines excluded by status or date. These values form the Tempolia column; do not replace any missing value with a worksheet assumption.
In a separate teaching column calculate 110 - 80 = +30 hours; 12,000 - 10,000 = EUR 2,000.00 still to invoice; 10,000 - 8,000 = EUR 2,000.00 still to collect; 10,000 - 5,720 - 480 = EUR 3,800.00 simple contribution. Do not call it official margin unless the report definition matches, and never present it as a result of the selected matter.
3. Reproduce the analysis in a pivot and export
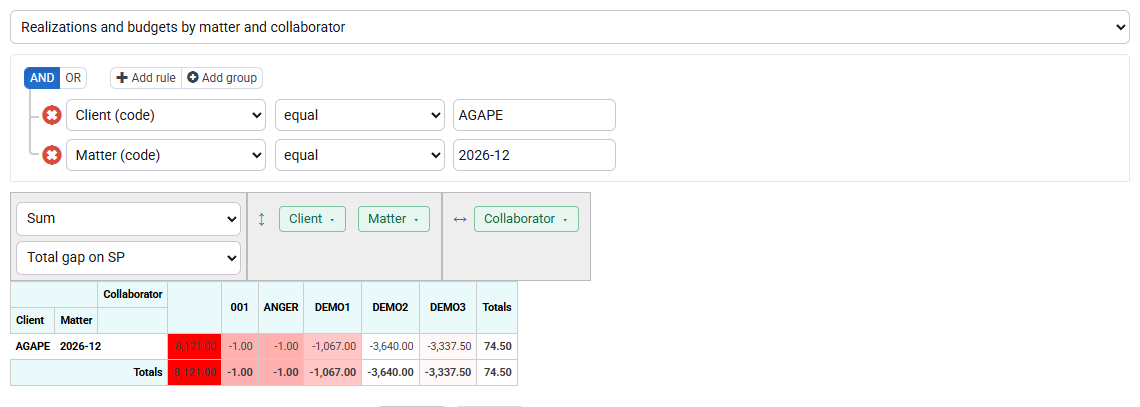
Create a pivot by matter and measure, with budget, time cost, expenses, invoiced and paid in separate columns. Preserve filters and units. Reconcile pivot totals to the five sources; never sum measures that describe different stages.
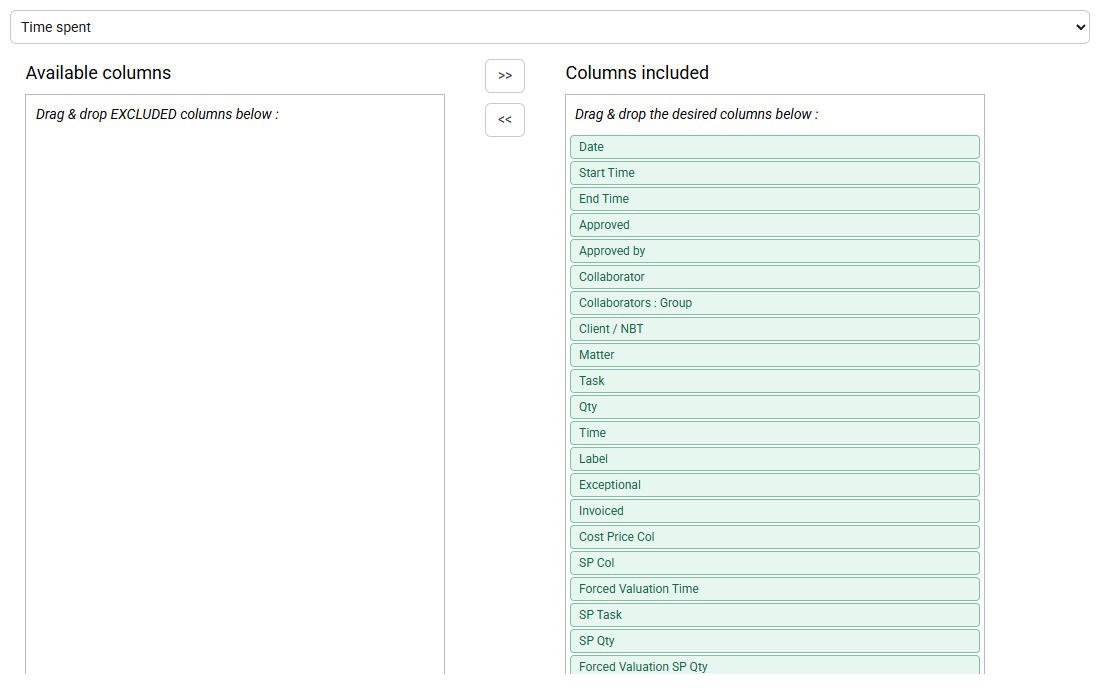
Export only after validation. Add a control sheet or file metadata with company, period, matter, filters, generation date, units and report definition. Excel calculations must remain traceable to source columns.
Guided restitution
- 1. Freeze the selected scope, run the populated report and record the actual total.
- 2. Reconcile the selected matter’s sources, then calculate the BATIS worksheet separately.
- 3. Reproduce the real result in a pivot and state actions supported by observed evidence.
- The selected matter’s sources reconcile to one documented perimeter.
- +30 hours, EUR 2,000 to invoice and EUR 2,000 to collect remain labelled as teaching calculations.
- Every real and teaching contribution is labelled with its definition and evidence status.
Diagnosis
- Unexpected total: inspect date, approval, rights and excluded tasks.
- Worksheet EUR 12,000 called invoiced on screen: teaching and real columns have been confused.
- Different user totals: compare filters, saved views and rights.
- Different margin: document rates, included costs and production-versus-invoicing basis.

Common mistakes
- Commenting on a number without preserving its filters.
- Mixing budget, production, invoicing and cash.
- Comparing reports with different periods or companies.
- Losing the source perimeter after Excel export.
- Ignoring access rights as a cause of different totals.
Before you finish
Present facts, calculations, interpretation and decision on separate lines. Another manager must reproduce 110 hours, EUR 5,720 cost, EUR 480 expenses, EUR 10,000 invoiced and EUR 8,000 paid from the documented teaching scope.
They must then repeat the navigation for the selected customer, matter and complete period, record the actual displayed total and explain why it is not replaced by 110 hours. Acceptance requires both calculations to remain separately labelled, sourced and reproducible. The hand-off also records report name, filters, generation time and indicator definition so a later reviewer can repeat it.
Build an indicator dictionary before sharing the dashboard
For each displayed measure, record its business meaning, grain, source screen, date rule, unit, sign, inclusions, exclusions and owner. “Time cost” must say whether it uses the rate at the work date or the current employee rate. “Invoiced” must say issued or prepared and net or gross. “Paid” must say whether unmatched payments and credits are included. “Margin” must provide its formula rather than relying on the heading.
Add one worked line from the teaching worksheet: 110 hours at EUR 52.00 equals EUR 5,720.00; EUR 10,000.00 invoiced minus that time cost and EUR 480.00 expenses equals EUR 3,800.00. Label this simple teaching contribution. It becomes an official indicator only if the selected report uses the identical basis. The dictionary allows another manager to understand why two plausible reports can disagree without assuming that one is broken.
Diagnose differences without moving the target
If totals differ, freeze both perimeters before changing anything. Compare company, matter, date field, status, rights, currency, net or gross basis and saved filters. Then return to line detail: one omitted timesheet, expense, credit note or unmatched payment often explains the difference. Preserve the export and generation timestamp used for the comparison. Do not adjust the period until the expected teaching total appears.
When pvcolaff or pvqaff contains no row for the selected matter, conclude only that no matter-specific override is observed there. Continue to the ordinary cost, sale and quantity sources used by the report. An empty override table neither proves that a default rate is correct nor calculates a margin. Record the applicable default rule separately and ask its owner if the calculation remains ambiguous.
Turn analysis into three owned actions
Write workload, billing and collection conclusions on separate lines. In the teaching case, +30 hours prompts investigation of scope, planning and production; EUR 2,000.00 below the commercial budget prompts a billing or engagement review; EUR 2,000.00 between invoiced and paid prompts customer follow-up. The EUR 3,800.00 contribution is a diagnostic result under a stated formula, not an automatic instruction.
For the selected matter, formulate actions only from the total actually observed for calendar year 2026 and from reconciled source lines. Assign an owner, due date and next measurement to every decision. A manager reviewing the file must be able to reproduce the number, distinguish worksheet values from Tempolia values and identify which additional evidence would be required before changing price, staffing or collection strategy.
Independent check on the selected matter
Use the selected customer, matter and complete period and record the total displayed. The 110-hour versus 80-hour calculation remains a separate teaching worksheet. Empty pvcolaff or pvqaff screens show no matter-specific override; they do not prove a margin.
Step back
A useful dashboard does not remove complexity; it makes definitions, perimeters and decisions explicit. Automate reproducible filters and reconciliations, but keep causal interpretation and management action under human review. The best indicator is one whose source and limit are understood well enough to know when not to use it.